GTKWave User Interface
GTKWave
Main Window
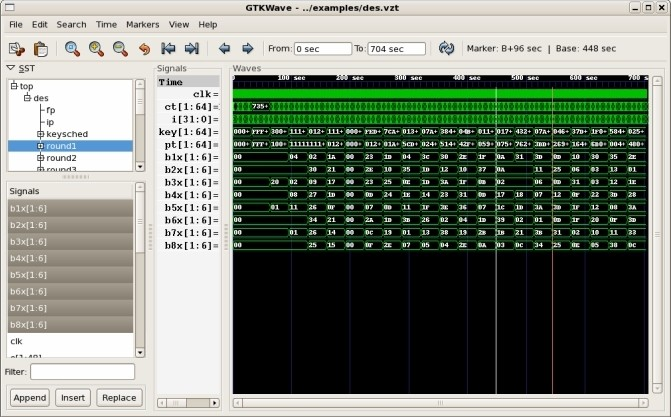
The GTKWave visualization tool main window is comprised of a menu bar section, a status window, several groups of buttons, a time status section, and signal and wave value sections. New with GTKWave 3.0 is the inclusion of an embedded Signal Search Tree (SST) expander to the left of the signal section. The viewer typically appears as below when the embedded SST is disabled.
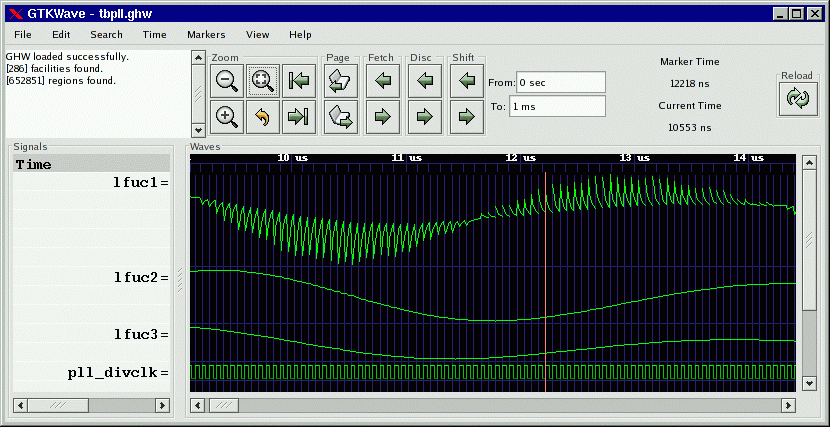
The GTKWave main window
To the extreme left in a frame marked “Signals” is the signal section. Signal names can be left or right aligned (left aligned being useful for detection of hierarchy differences) and the number of levels of hierarchy (as counting from the rightmost side of a signal name) displayed can be set by the user.
To the right of the signal section is the wave section in a frame marked “Waves”. The top line is used as a timescale and all other lines are used to render trace value data with respect the timescale. The vertical blue lines in the trace value data section are not normally present. In this case they are the result of keying on the rising edge of the digital signal “pll_divclk”. Analog traces of varying heights can be seen as well. Analog traces can dynamically be made as tall or short as desired in order to make the viewing of them easier, however the size is limited to integer multiples of the height of one digital trace.
With GTK versions greater than or equal to 2.4, an embedded SST is available. Drag and Drop of signals from the “Signals” pane inside the SST into the “Signals” pane outside of the SST is a convenient way to import signals into the viewer.
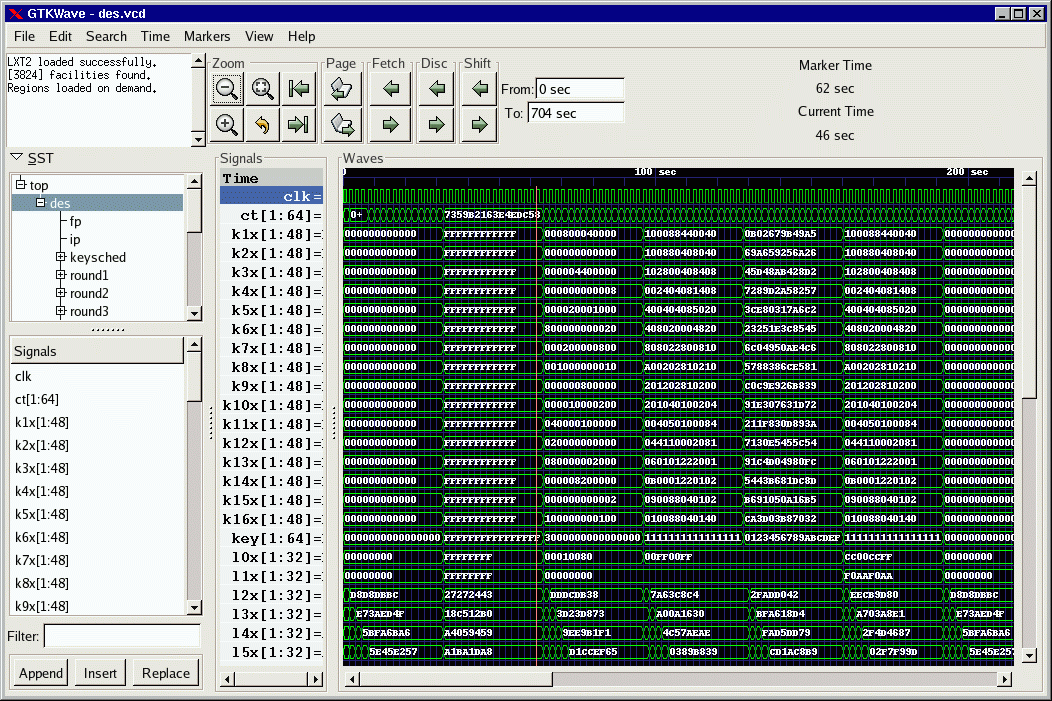
The main window with an embedded SST
The main window size and position can be saved between sessions as well as the current viewer state. (i.e., which signals are visible, any attributes set for those signals such as alignment and inversion, where the markers are set, and what pattern marking is active.)
Depending on the capabilities of the file format loaded into GTKWave, the SST frame/window may also depict the type of hierarchy being shown. The figures below are representative of FST.
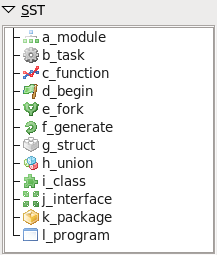
Verilog hierarchy type icons in SST frame
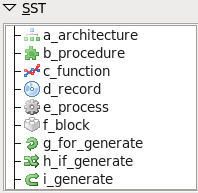
VHDL (not GHDL) hierarchy type icons in SST frame
In addition, signal direction and type information may be displayed in the lower portion of the SST frame/window as shown. To filter based on I/O port direction, prefix the search regular expression with case-insensitive +I+ for input, +IO+ for input/output, +O+ for output, +L+ for linkage (VHDL), and +B+ for buffer (VHDL). Negative matching occurs such that – only displays I/O ports, -I- displays all but inputs, and -O- displays all but outputs. In a similar fashion, ++ displays all except I/O ports.
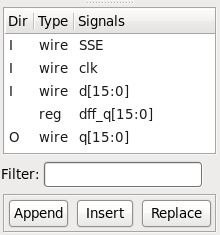
Verilog I/O and type information in SST frame
Signal Subwindow
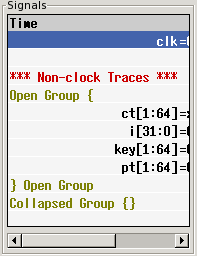
Signal subwindow with scrollbar and an “open” collapsible trace
The signal subwindow is nothing more than a list of signals, optional comments, and optional blank lines. The following is a sample view of the signal subwindow showing a highlighted trace (“clk”) and a comment trace, “Non-clock Traces ***”. In between the two is a blank trace inserted by the user. Note that the highlighting of a trace can be accomplished by clicking the left mouse button on an entry in the signal subwindow. (Use Control+Click to deselect.)
You will notice that the scrollbar along the bottom of the subwindow in indicates that there is a hidden section to the right. This hidden area contains the values of the signals shown. The scrollbar can be manually moved to show this area or the pane to the right of the signal subwindow can be enlarged in order to allow full viewing of the subwindow.
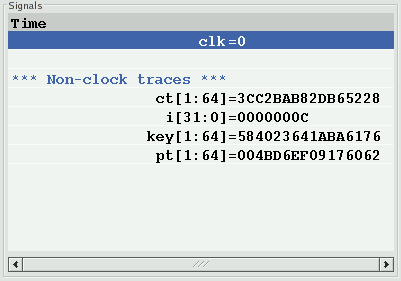
Signal subwindow with no hidden area from left to right
Expanding the size of the subwindow by increasing the width of the pane is illustrated in . No area is hidden as reflected by the scrollbar which is completely filled in from left to right along its length. In addition, the signal values which are present can be read. Any time the primary marker is nailed down, there will be an equals (“=”) sign indicating that signal values are present.

Signal subwindow with left justified signal names
As seen in both and , the signal names are right justified and are flush against the equals signs. This is only a matter of personal preference, and if desired, as shown in , the signals can be left justified against the left margin of the signal subwindow by pressing the key combination of Shift+Home. This is useful when looking at signals if one is attempting to determine where hierarchies for different net names differ. Press Shift+End to right justify the signal names. (Right justification is the default behavior). Regardless of the state of signal name justification, the signal values are left justified against the equals sign and cannot be moved.
Note that the signal subwindow supports a form of self-contained Drag and Drop such that the right mouse button can be used to harvest all the highlighted traces in the window. By holding the right button and moving the mouse up and down, a destination for the traces can be selected. When the mouse button is released, the traces are dropped at the trace following the one the mouse pointer is pointing to.
Multiple traces can be selected by marking the first trace to highlight, move the cursor to the destination trace, and Shift+Click with the left mouse button. All the traces between the two will highlight or unhighlight accordingly. To highlight all the traces in the signal subwindow, Alt+H can be pressed. To unhighlight them, also press the Shift key in conjunction with Alt-H. (This can also be achieved by clocking on Highlight All or Unhighlight All in the Edit menu.)
Highlighting or unhighlighting traces by entering regular expressions will be covered in the menu section.
Note: the rc variable use_standard_clicking no longer has any effect. Regular GTK semantics for this subwindow are always enabled: shift and control function as most users expect. In addition, the scroll wheel will scroll the traces up and down provided the signal subwindow has input focus.
Wave Subwindow
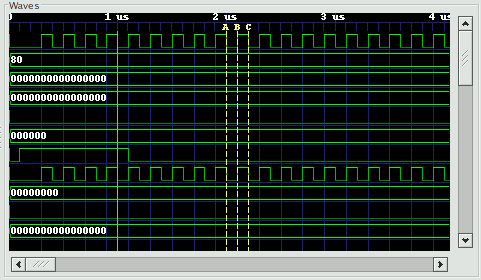
A typical view of the wave subwindow
The wave subwindow reformats simulation data into a visual format similar to that seen for digital storage scopes. As seen in, the wave subwindow contains two scrollbars and a viewing area.
The scrollbar on the right scrolls not only the wave subwindow, but the signal subwindow in lockstep as well. The scrollbar on the bottom is used to scroll the simulation data with respect to the timescale that is shown on the top line of the wave subwindow.
The simulation data itself is shown as a horizontal series of traces. Values for multi-bit signals can be displayed in varying numeric bases such as binary, octal, hexadecimal, decimal, and ASCII. Values for single-bit traces are shown as “high” for zero and “low” for one, “z” (middle), and “x” (filled-in box). VHDL values are represented in a similar fashion but with different colors. The signal subwindow can always be used to verify the value of a value, so don’t be too concerned right now if you are not sure of what the single-bit representation of a signal looks like or are not sure if you can remember.
Two functional markers are available: the primary marker (red, left mouse button) which the signal window uses as its pointer for value data, and the baseline marker (white, middle mouse button) which is used to perform time measurements with respect to the primary marker. Twenty-six lettered markers “A” through “Z” (dropped or collected through menu options) are provided to the user as convenience markers for indexing various points of interest in a simulation.
The primary marker can also be used to navigate with respect to time. It can be dropped with the right mouse button and dragged to “open” up a region for zooming in closer or out farther in time. It can also be used to scroll by holding down the left mouse button and dragging the mouse outside the signal subwindow. The simulation data outside of the window will then scroll into view with the scrolling being in the opposite direction that the primary marker is “pulling” outside of the subwindow.
Trace data in the signal subwindow can also be timeshifted as shown in . In order to timeshift a trace, highlight the trace in the signal window the move over to the wave subwindow and then hold down the left mouse button in order to set the primary marker. Press the Control key then move the primary marker left or right. When the timeshift is as desired, release the mouse button then release Control. If you do not wish to go through with the timeshift, release the Control key before releasing the left mouse button. The trace(s) will then spring back to their original pre-shifted position.

An example of both positively and negatively timeshifted traces
To achieve a finer level of granularity for timeshifting, menu options are available that allow the user to set specific values for a time shift. In this way, the pixel resolution of zoom is not the limiting factor in achieving an “exact” shift that suits a user’s needs.
TwinWave
TwinWave is a front end to GTKWave that allows two sessions to be open at one time in a single window. The horizontal scrolling, zoom factor, primary marker, and secondary marker are synchronized between the two sessions.
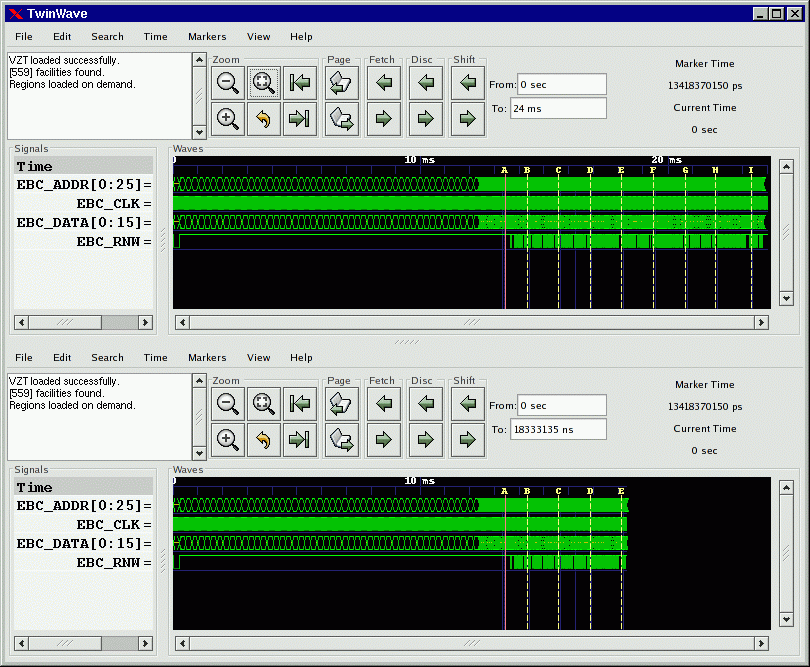
TwinWave managing two GTKWave sessions in a single window
Starting a TwinWave session is easy: simply invoke twinwave with the arguments for each gtkwave session listed fully separating them with a plus sign.
twinwave a.vcd a.sav + b.vcd b.sav
RTLBrowse
rtlbrowse is usually called as a helper application by gtkwave. In order to use RTLBrowse, Verilog source code must first be compiled with xml2stems in order to generate a stems file. A stems file contains hierarchy and component instantiation information used to navigate quickly through the source code. If GTKWave is started with the –stems option, the stems file is parsed and rtlbrowse is launched.
The main window for RTLBrowse depicts the design as a tree-like structure. (See on page .) Nodes in the tree may be clicked open or closed in order to navigate through the design hierarchy. Missing modules (unparsed, but instantiated as components) will be marked as “[MISSING]”.
When an item is selected, another window is opened showing only the source code the selected module. If the primary marker is set, then the source code will be annotated with values as shown in on page . If the primary marker moves or is deleted, then the values annotated into the source code will be updated dynamically. The values shown are the full, wide value of the signal. RTLBrowse currently does not perform bit extractions on multi-bit vectors. If it is desired to see the full source code file for a module, click on the “View Full File” button at the bottom of the window.
Note that it is possible to descend deeper into the design hierarchy by selecting the component name in the annotated or unannotated source code.
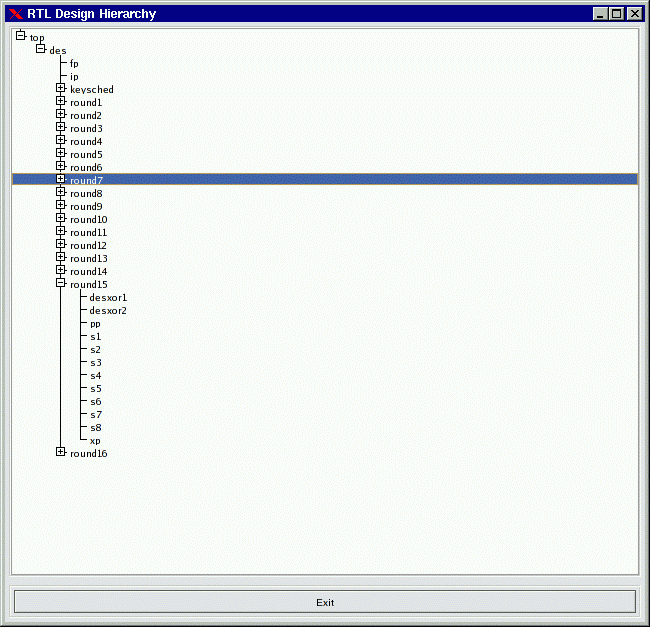
The RTLBrowse RTL Design Hierarchy window
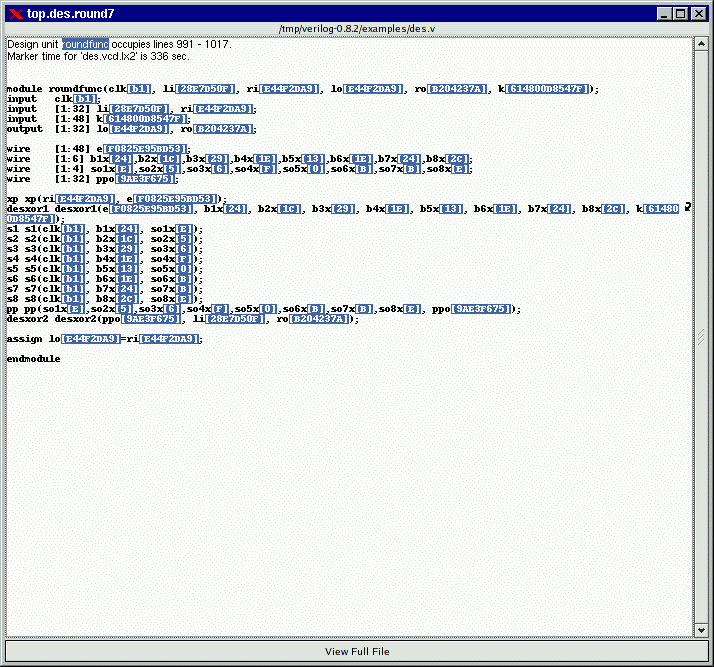
Source code annotated by RTLBrowse
Ergonomic Extras
Scroll Wheels
Users with a scroll wheel mouse have some extra one-handed operations options available which correspond to some functions found in the Navigation and Status Panel description on page 27.
Function |
Shortcut |
|---|---|
Shift Right |
Control+Scroll_Wheel_Down |
Shift Left |
Control+Scroll_Wheel_Up |
Page Right |
Scroll_Wheel_Down |
Page Left |
Scroll_Wheel_Up |
Zoom In |
Alt+Scroll_Wheel_Down |
Zoom Out |
Alt+Scroll_Wheel_Up |
Turning the scroll wheel “presses” the shift, page, and zoom options repeatedly far faster than is possible with the navigation buttons. Zoom functions are especially smooth this way.
The Primary Marker
The primary marker has also had function overloaded onto it for user convenience. Besides being used as a marker, it can also be used to navigate with respect to time. It can be dropped with the right mouse button and dragged to “open” up a region for zooming in closer or out farther in time. It can also be used to scroll by holding down the left mouse button and dragging the mouse outside the signal subwindow. The simulation data outside of the window will then scroll into view with the scrolling being in the opposite direction that the primary marker is “pulling” outside of the subwindow.
Interactive VCD
VCD files may be viewed as they are generated provided that they are written to a fifo (pipe) and are trampolined through shmidcat first (assume the simulator will normally generate outfile.vcd):
mkfifo outfile.vcd
cver myverilog.v &
shmidcat outfile.vcd | gtkwave -v -I myverilog.sav
You can then navigate the file as simulation is running and watch it update.
